Was this content helpful?
How could we make this article more helpful?
Monitoring

Monitoring provides a summary of the NAS's hardware and the health of its components.
System tab
Note: Your NAS OS device may not include all the features listed below.

- a: A green check mark indicates that your hardware is operational and there are no problems. A red "X" alerts you to potential problems with the hardware. It is accompanied by an error message, such as the device has reached a critical temperature (see note below). The running time indicates consecutive hours and minutes of operation. The clock will restart each time the device is powered on, restarted, or wakes up from deep sleep mode.
- b: The temperature of the device's CPU and casing, as well as line graphs that measures the average speed of the device's built-in fans. The highest point on the line graph is the fan's greatest speed.
- c: (8-bay Rackmount NAS only) Green lights next to Power supply and Casing indicate that both are operating as expected. Red lights will appear if errors have been found.
- Sound: Click on the slider to turn off audible alerts. The NAS will not sound an alarm, even if an error is detected.
- ID light: Click on the slider to turn on the ID LED. The ID LEDs in the front and rear of the NAS will amber and the audible alert will sound. The alert does not sound, check the status of the mute button.
- d: Choose Details to view expanded graphs of the CPU, RAM, and Network meters. Select the pull-down menu to see the performance for each LAN port.
- e: Review the performance meters for the CPU, RAM, and Network.
- f: A green circle next to the LAN means that it is connected to the network. A grey circle means that the LAN is not connected to the network.
Temperature and fans
- Temperature error: Check the placement of your NAS to make certain that it is not receiving an abnormal amount of heat from external sources (e.g. sun from a window, heating duct, exhaust from other electronics, etc.). If the problem persists, see Getting Help for links to contact customer support.
- Fan error: Check the fan performance line graph to determine if the fans are running too high or not at all. If the device is overheated as well, follow the directions listed above for a temperature error. Otherwise, see Getting Help for links to contact customer support.
- Drive error: Select the Drive tab to review the status for the NAS's disks. See Drive tab for instructions on running tests on the disks.
Drive tab
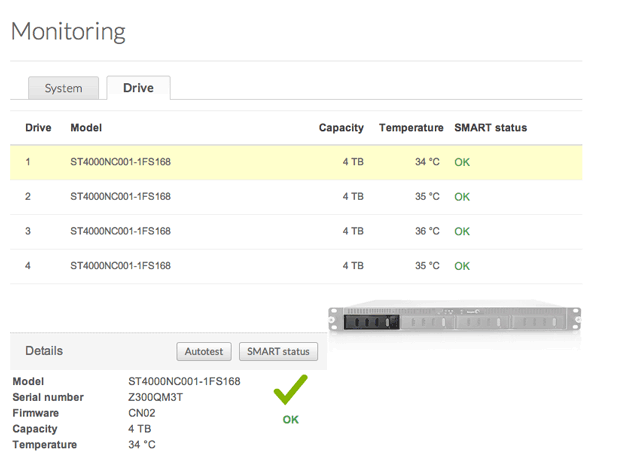
SMART stands for Self-Monitoring, Analysis and Reporting Technology. SMART status should be used for informational purposes only, specifically when diagnosing hard drives.

- a: Review basic information for each disk in the enclosure, including the model number, capacity, temperature, and SMART status.
- Acceptable Temperature values may differ based upon the make and model of the hard disk.
- SMART status lets you know if the disk is reporting or experiencing errors. If the disk has an error, run a SMART test by selecting the Autotest button.
- b: The dynamic photo of your NAS's disks will highlight the drive selected in the disk pane.
- c: See specific details of the hard disk selected in the disk pane. If the disk has an error, run a SMART test by selecting the Autotest button.
- d: To determine the SMART status, select a hard drive in the disk pane and choose Autotest.
- e: Choose SMART status to review the details of the selected disk.