- ASEAN (English)
- Australia/New Zealand (English)
- Belgique (Français)
- België (Nederlands)
- Brasil (Português)
- Canada (English)
- Canada (Français)
- Deutschland (Deutsch)
- España (Español)
- France (Français)
- India (English)
- Indonesia (Indonesian)
- Italia (Italiano)
- Latinoamérica (Español)
- Middle East/North Africa (English)
- Nederland (Nederlands)
- Polska (Polski)
- Portugal (Português)
- Singapore (English)
- Türkiye (Türkçe)
- United Kingdom (English)
- United States (English)
- 中国 (简体中文)
- 台灣 (繁體中文)
- 日本 (日本語)
- 대한민국 (한국어)
- Home /
- Lyve Management Portal /
- Reports Management
Was this content helpful?
How could we make this article more helpful?
OPEN MENU CLOSE MENU
- Welcome
- Lyve Products and Services
- Getting Started
- Account and Billing Management
- Multi-Account Management
- Org Management
- Membership Management
- Lyve Mobile Subscriptions
- Lyve Cloud Subscriptions
- Lyve Cloud Deployment Management
- Lyve Systems Leasing Subscriptions
- Device Management
- Security Management
- Quotes Management
- Reports Management
- Lyve Support Center
Reports Management
Reports provide visual summaries of usage metrics for Lyve Cloud subscriptions only.
View Lyve Cloud usage reports
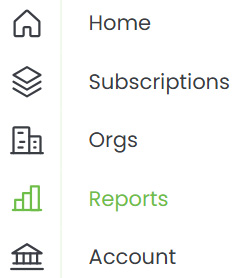
- On the Home page, select Reports in the sidebar.

- Select the Date Range dropdown to select a predefined time period.
To define a custom period, select Custom Date Range, then enter the From Date and To Date.
- Select the Deployment dropdown and specify a deployment.
The following chart is displayed:
| Lyve Cloud TB of Usage |
|---|
Shows total storage usage over time.
|
View Lyve Cloud usage, object count, and upload/download traffic reports
- On the Home page, select Subscriptions in the sidebar.
- Select a Lyve Cloud subscription from the Subscriptions list.
- Select a deployment from the Deployments list.
- Select Reports from the sidebar.

- Select the Date Range dropdown to select a predefined time period.
To define a custom period, select Custom Date Range, then enter the From Date and To Date.
Three charts are displayed on this page:
| Lyve Cloud TB of Usage |
|---|
Shows total storage usage over time.
|
| Lyve Cloud Object Count |
|---|
| Shows the number of objects stored over time. |
| Lyve Cloud Upload/Download Traffic |
|---|
Shows data uploaded and downloaded over time.
|
For all three charts:
- Click anywhere on the line to see the specific value for that point in time.
- Select the Download icon to export a copy to your local device.

- Select the Reset icon to reset all filters.

Lyve Management Portal User Manual